jQuery flot stacked bar chart example
Flot is a JavaScript plotting library for jQuery. Here are my steps to create a simplified version of the stacked bar chart example from the flot examples page. For more information, see the API documentation.
- Download and unpack:
cd ~/src/jquery/flot_examples
curl http://flot.googlecode.com/files/flot-0.6.tar.gz | tar xzf -
~/src/jquery/flot_examples/stacked_bar_ex.html:<!DOCTYPE HTML PUBLIC "-//W3C//DTD HTML 4.01//EN" "http://www.w3.org/TR/html4/strict.dtd"> <html> <head> <meta http-equiv="Content-Type" content="text/html; charset=utf-8" /> <!--[if IE]><script language="javascript" type="text/javascript" src="flot/excanvas.min.js"></script><![endif]--> <script type="text/javascript" src="http://ajax.googleapis.com/ajax/libs/jquery/1.4.2/jquery.min.js"></script> <script type="text/javascript" src="flot/jquery.flot.js"></script> <script type="text/javascript" src="flot/jquery.flot.stack.js"></script> <title>Flot stacked bar example</title> </head> <body> <div id="placeholder" style="width:550px;height:200px;"></div> <script type="text/javascript" src="stacked_bar_ex.js"></script> </body> </html>
~/src/jquery/flot_examples/stacked_bar_ex.js:$(function () { var css_id = "#placeholder"; var data = [ {label: 'foo', data: [[1,300], [2,300], [3,300], [4,300], [5,300]]}, {label: 'bar', data: [[1,800], [2,600], [3,400], [4,200], [5,0]]}, {label: 'baz', data: [[1,100], [2,200], [3,300], [4,400], [5,500]]}, ]; var options = { series: {stack: 0, lines: {show: false, steps: false }, bars: {show: true, barWidth: 0.9, align: 'center',},}, xaxis: {ticks: [[1,'One'], [2,'Two'], [3,'Three'], [4,'Four'], [5,'Five']]}, }; $.plot($(css_id), data, options); });
- View
~/src/jquery/flot_examples/stacked_bar_ex.htmlin the browser: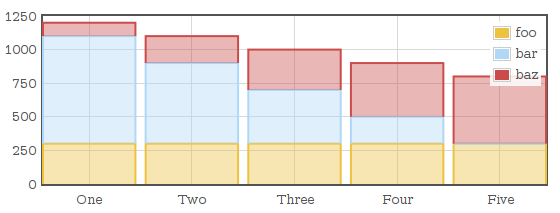
Related posts
- How to use ast-grep with GraphQL — posted 2024-09-24
- Next.js App Router (RSC) projects w/ open source code — posted 2024-07-30
- Next.js Relay GraphQL Pokemon example — posted 2024-05-22
- Example Node.js Passport.js SAML app using OneLogin — posted 2024-05-10
- Aphrodite to CSS Modules codemod — posted 2022-12-09
- Simple codemod example with jscodeshift — posted 2021-05-03
Comments
Excellent Post!
I've just today been looking at Flot to create some charts for work and this really helped me grasp how to create a stack chart with custom labels on the x-axis.
Thanks so much
See how the plugin paints a blue line on the number far bar where he value for "bar" is 0? I'd call this undesirable behavior, or at least I wouldn't desire it in my graphs. Is there any way to fix this?
yes you can hide the bar having zero by setting its x-axis data to null, in above case javascript code would be data[1].data[4][0]=null
this example is very useful for us and understanding is easy by this.
Thanks for this post. I found the examples in the package annoying as they displayed example graphs but without the code written out nicely to generate it.
Do you see how the colors in the legend go from top to bottom, whereas they stack on the graph from bottom to top? Is there any way to make the colors appear inverted in the legend so they match the visual order of the graph?
thank you for keeping nice and simple
Awesome! Great tutorial. One question, is there away to control the position of the legend? Mine is aligned to the left edge of the graph and is extending the entire width of the graph. I'd like to position it outside of the graph, just to the right of it
how do u set the steps/intervels for the axis like for the X axis i want the number 0,1,2... and for Y axis i want 0,5,10,15,...
also can i rotate the labled in the Y axis for eg: One, Two.... can i rotate them by 90 degree...
Stacks of thanks for posting and helping to destroy my flot learning curve! I needed to come up quick and working from examples is how I learn. You get a gold star.
Hi thanks for your help. But do you know how to do this without stacking? Thanks.
How to set input in array? Axis Y : 1,23,42,45 Axis X : 1 to 10
works like charm! thanks!
thanks! it help me a lot.
To answer to two of the questions:
to change color just add item'color' : [your color] in the array data like
var data = [ {label: 'foo', data: [[1,300], [2,300], [3,300], [4,300], [5,300]], color: 'red'}, {label: 'bar', data: [[1,800], [2,600], [3,400], [4,200], [5,0]], color: "rgba(255, 0, 0, 1)"}, {label: 'baz', data: [[1,100], [2,200], [3,300], [4,400], [5,500]], color: orange}, ];
to have the legend outside the graph just create another graph, the same in a div next to the graph div but with all option at false except the legend like:
//the option with legend set to false var options = { series: {stack: 0, lines: {show: false, steps: false }, bars: {show: true, barWidth: 0.9, align: 'center',},}, legend: { show: false }, xaxis: {ticks: [[1,'One'], [2,'Two'], [3,'Three'], [4,'Four'], [5,'Five']]}, };
//your true graph without legend $.plot($(css_id), data, options);
//the option with only legend
var options = { series: {stack: 0, lines: {show: false, steps: false }, bars: {show: false, barWidth: 0.9, align: 'center',},}, legend: { show: true, position: "ne", backgroundOpacity: 0.2 }, xaxis: { show: false}, yaxis: { show: false} };
//the graph with only the legend placed in the div you want (id=place+"Leg") $.plot($(css_id), data, options);
Then you control the position and the size of your legend outside the true graph with its div. Regards Francois
i want to change the bar color and need to assign certain limit for exg:: xaxis 0-5 & 100-500 color :#EDF5FF xaxis 5-10 & 500-1000 color :#EDF5HH
disqus:1927323932
is it open source or payable for commercial use
disqus:2026588880
Can I connect the chart to csv or json and filter data based on user inputs?
disqus:2509450964
Instead of integer value is it possible to have String value in my x-axis and if you have any example for that it would be great
disqus:2804534922
How to show tool tip for the above stacked graph?
disqus:2806721856
